決定木
データ全体を説明変数を用いて段階的にグループ分けする手法。
決定木を書く
テキストではmvpartパッケージを使用しているが、現在は公開が停止されているので代わりにpartykitパッケージを使用する。
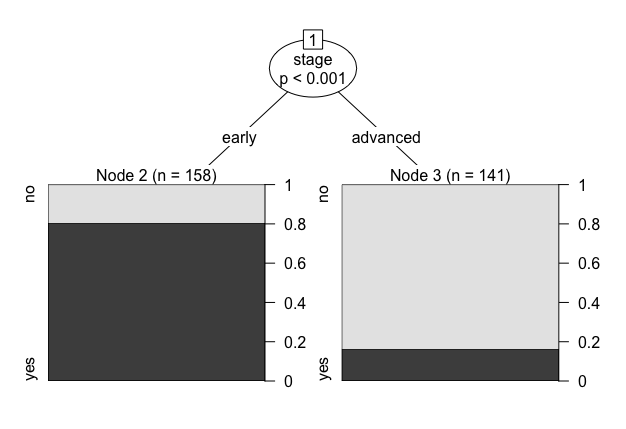
rpart()の代わりに使う関数はctree()であるが、引数の入れ方はほとんど変わらない。結果はpartyオブジェクトになっているので、そのままプロットすれば決定木が表示される。
library(partykit)
library(vcd)
result <- ctree(survival ~ stage + operation + xray, weight = Freq,
                data = OvaryCancer)
result
# Model formula:
# survival ~ stage + operation + xray
#
# Fitted party:
# [1] root
# |   [2] stage in early: yes (n = 158, err = 19.6%)
# |   [3] stage in advanced: no (n = 141, err = 16.3%)
#
# Number of inner nodes:    1
# Number of terminal nodes: 2
plot(result)

量的変数を用いる
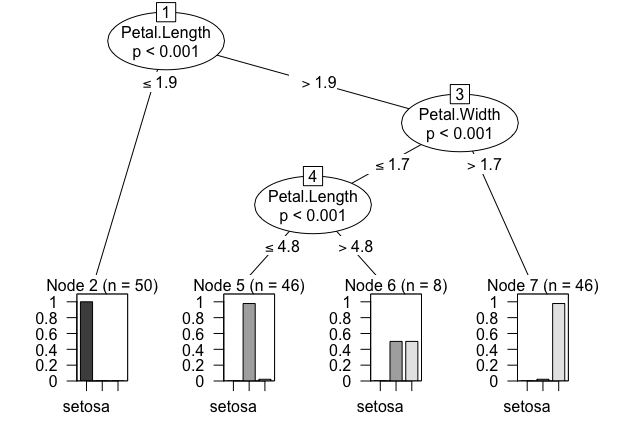
ctree()を使った結果はテキストと若干異なる。
# 量的変数を用いたグループ分け
data(iris)
result <- ctree(Species ~ ., data = iris)
result
# Model formula:
#   Species ~ Sepal.Length + Sepal.Width + Petal.Length + Petal.Width
#
# Fitted party:
#   [1] root
# |   [2] Petal.Length <= 1.9: setosa (n = 50, err = 0.0%)
# |   [3] Petal.Length > 1.9
# |   |   [4] Petal.Width <= 1.7
# |   |   |   [5] Petal.Length <= 4.8: versicolor (n = 46, err = 2.2%)
# |   |   |   [6] Petal.Length > 4.8: versicolor (n = 8, err = 50.0%)
# |   |   [7] Petal.Width > 1.7: virginica (n = 46, err = 2.2%)
#
# Number of inner nodes:    3
# Number of terminal nodes: 4
plot(result)

また、predict()にtypeオプションの指定は必要ない。
iris$est <- predict(result)
xtabs( ~ Species + est, data = iris)
#             est
# Species      setosa versicolor virginica
#   setosa         50          0         0
#   versicolor      0         49         1
#   virginica       0          5        45
順序カテゴリカルデータ
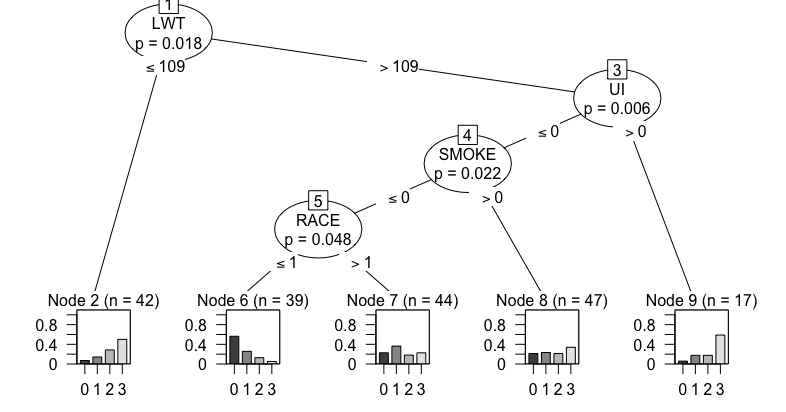
パッケージrpartOrdinalも既に公開されていないが、これもctree()で解析できる。目的変数が順序カテゴリカルデータになっていれば特にオプションの指定は必要ない様だ。
データセットはパッケージRSADBEに同様の物が入っているのでこれを利用する。
library(RSADBE)
data("lowbwt")
lowbwt$Category <- factor(ifelse(lowbwt$BWT <= 2500, 3,
                                 ifelse(lowbwt$BWT <= 3000, 2,
                                        ifelse(lowbwt$BWT <= 3500, 1, 0))),
                          ordered = TRUE)
ord.rpart <- ctree(Category ~ AGE + LWT + RACE + SMOKE + PTL + HT + UI + FTV,
                   data = lowbwt)
ord.rpart

# Model formula:
#   Category ~ AGE + LWT + RACE + SMOKE + PTL + HT + UI + FTV
#
# Fitted party:
#   [1] root
# |   [2] LWT <= 109: 3 (n = 42, err = 50.0%)
# |   [3] LWT > 109
# |   |   [4] UI <= 0
# |   |   |   [5] SMOKE <= 0
# |   |   |   |   [6] RACE <= 1: 0 (n = 39, err = 43.6%)
# |   |   |   |   [7] RACE > 1: 1 (n = 44, err = 63.6%)
# |   |   |   [8] SMOKE > 0: 3 (n = 47, err = 66.0%)
# |   |   [9] UI > 0: 3 (n = 17, err = 41.2%)
#
# Number of inner nodes:    4
# Number of terminal nodes: 5

plot(ord.rpart)
